What it takes to be rich in Europe
Zusammenfassen mit


Beitrag teilen auf


Here’s a tricky question: Are you rich?
There’s no safe answer. If you say yes, you risk sounding arrogant. But if you say no, you risk seeming ungrateful. The question forces an uncomfortable comparison between yourself and others, and your answer will change depending on whether you are looking at neighbors, or fellow citizens, or people across borders.
To figure out who is really „rich“ across Europe, the Germany-based accounting firm BuchhaltungsButler and the data research experts at DataPulse Research ran the numbers. They compared populations within and between several European countries, adjusting for cost of living and noting where it’s hardest to climb the income ladder.
Striking It „Rich“ in Each Country
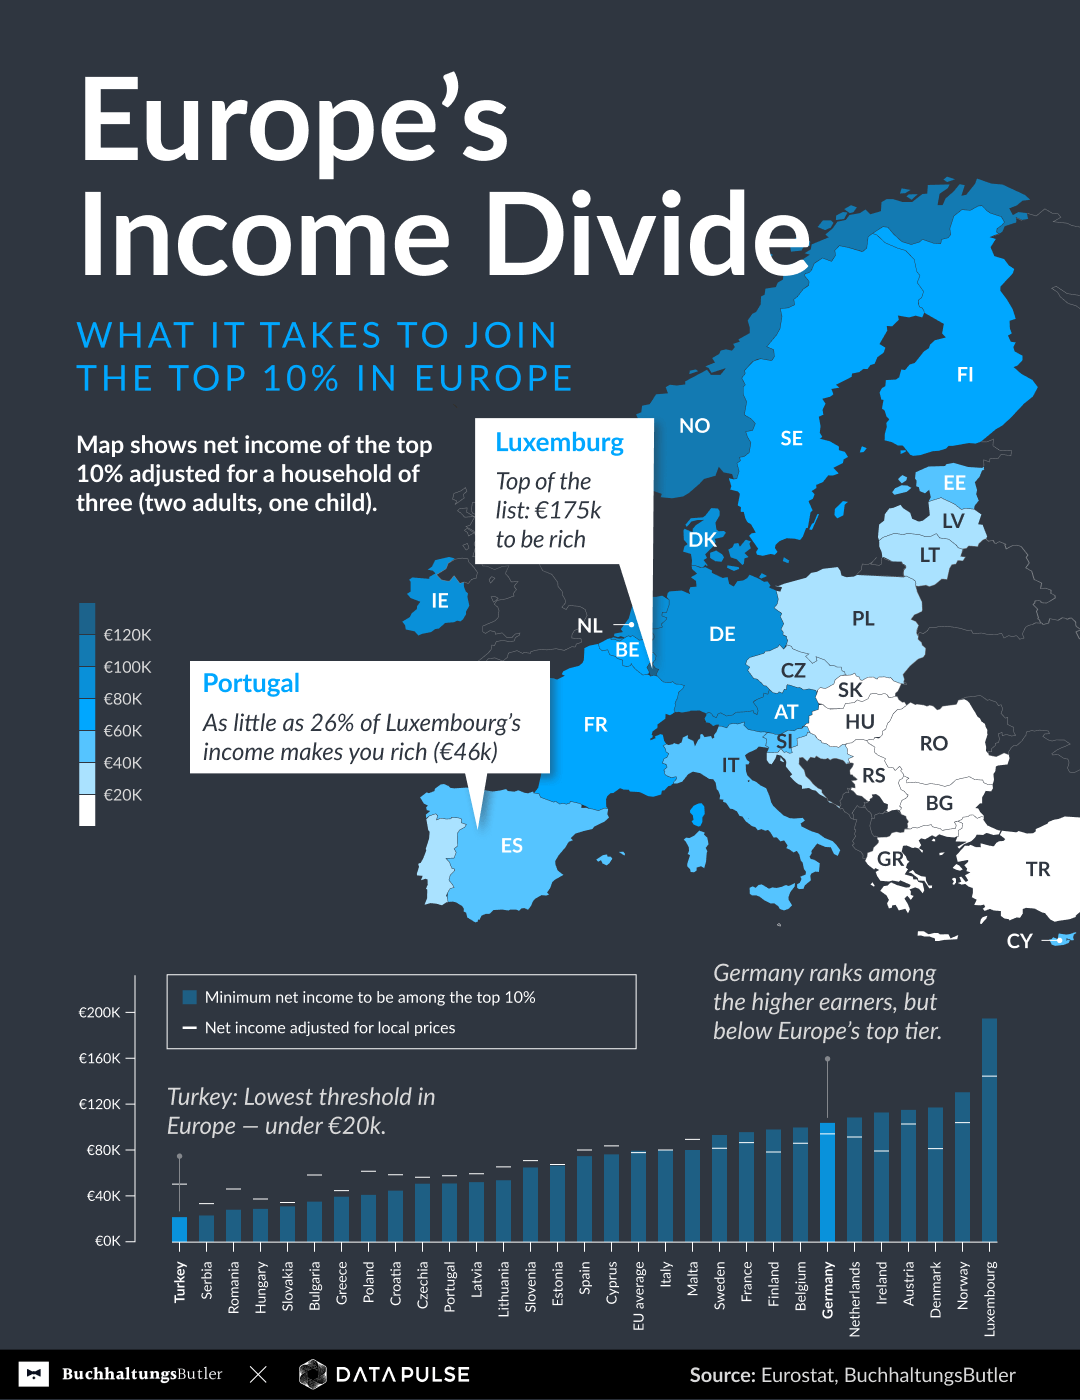
This study defines rich as the estimated net income required for a household of three to reach the top 10% of earners nationally. In other words: after taxes and deductions, this is approximately how much two adults and a child under 14 need to out-earn 90% of similarly composed households. All figures are shown in euros (converted from national currencies where applicable) for comparability.
Reaching the top varies from country to country. Highest on the list sits Luxembourg, where the top-earning households net at least €175,000 a year. That’s almost four times the threshold in Portugal (€46,000) and more than nine times the threshold in Turkey (€19,000).
Across European countries, the benchmark threshold for a household of three to make it rich is around €71,000, based on an EU average. But as the map above shows, the Nordic and alpine countries tend to be above that average and Eastern European countries tend to be below it. Western European countries tend to be near the middle, with some differences: Italy and Spain hover around €70,000, while Portugal sits closer to Eastern European levels.
However, these numbers don’t account for the fact that a euro buys very different things in, for example, Lisbon versus Oslo. In the next section we explore what those income levels actually translate into in terms of real purchasing power.
How Cost of Living Reshapes Europe’s Rich List
To make a fairer comparison that adjusts for cost of living, the researchers looked at what money can actually buy. Generally, countries where the rich don’t make as much tend to be cheaper places to live overall, while countries where the rich make a lot more tend to be more expensive places to live.
The chart below shows how much a household of three would need to have after taxes and other deductibles to be considered rich, but each country also has a line marking the reality of that money after adjusting for cost of living. In Luxembourg, for instance, €175,000 shrinks to about €130,000 in real purchasing power. While in Turkey, for example, the cost of goods is relatively cheaper, so €19,000 feels more like €46,000.
Adjusting for purchasing power narrows, but doesn’t erase, Europe’s income gaps. Without this adjustment, the differences between richer and poorer countries appear enormous. With it, the ranking shifts: countries with lower prices suddenly climb higher, while expensive economies lose some ground.
Here’s another way to look at it: In the chart below, countries on or near the diagonal line have economies where prices and paychecks balance out about evenly (based on an EU average). For countries on the upper-left side of the line, each euro amount can stretch further once local prices are factored in. For countries on the lower-right side of the line, steep prices erode earnings.
Luxembourg is still at the top, whether or not there’s a cost of living adjustment. But for other countries the hierarchy shifts. Germany, for instance, slides from 7th place to 4th, because the euro goes further there than in countries like Ireland and the Netherlands. In Spain, net earnings of €67,000 can effectively get the same lifestyle as €105,000 does in Denmark. In Turkey, the top earners can buy more than their counterparts in several European countries including Greece, Slovakia, and Romania.
When the Rich Pull Away From the Middle
From country to country, the distance between the middle class and the rich looks very different. This gap depends on how income is distributed across society. In some places, the middle and upper tiers are relatively close, while in others, the rich earn two or three times as much. In most cases though, those at the top earn far more than those at the middle, a sign of income inequality. And the wider the gap, the more unequal a country tends to be.
When talking about inequality it’s worth pausing on what the actual income levels look like across European countries. The chart below compares the net earnings of middle-class households (at approximately the 50th percentile) to those at the rich threshold (at about the 90th percentile). At first glance, some countries appear surprisingly equal. In Turkey, for example, the nominal difference between middle-earning and high-earning households looks small because both groups make relatively little. In contrast, Luxembourg shows the opposite: very high absolute incomes and a much wider gap in euro terms.
But this impression is misleading. To understand who’s truly pulling ahead, we need to look at relative differences: how many times richer the top 10% are than the middle class. The following chart explores exactly that.
Comparing the net disposable income of those at the „rich“ threshold, with those at the middle-income level it becomes apparent that In Slovakia, for example, those just inside the top 10% earn about 65% more than the middle class. That’s a relatively small gap by European standards. Similar ratios appear in Norway (77% more), Slovenia and Hungary (82%), and Belgium (83%). However, in most other countries, the distance is bigger. In Greece, Germany, and France, the middle class would need to double their earnings to reach the top 10%.
And, if we look at Turkey again, it is now at the far end and looks like one of Europe’s most unequal countries. The rich earn several times more than the middle class (215%!). Luxembourg’s numbers also paint a different image. The rich earn about twice as much as the middle class, not extreme in percentage terms (yet in raw euros, the gap is enormous).
These income gaps don’t just shape perception, they have real economic weight. When the top 10% earn far more than the middle class, they also tend to capture a much larger share of the country’s total income. In other words, big gaps mean a big concentration of economic power.
In countries where top earners make two or three times as much as the middle class, the rich typically hold a disproportionate share of the wealth generated by income. Across 27 European countries, the richest 10% hold about 24% of all earnings. But in eight countries, that share rises to between 25% and 36%, as shown in the charts below.
When the top 10% holds more of the total income, it often points to weak wage growth among the middle class or tax systems that favor high earners. In contrast, a smaller share is often seen in countries with strong labor protections, progressive taxation, or robust social transfers that keep income more evenly distributed.
Europe’s Income Paradox
Even when there’s a clear threshold for being rich, it turns out the concept is deeply relative. Being rich doesn’t mean the same thing in every country, or even within one. A high income can vanish quickly in an expensive city, while a modest salary elsewhere might still buy comfort and security.
The numbers reveal a paradox: As Europe grows more integrated economically, inequality is becoming less visible between countries, but more pronounced within some countries. In other words, it seems like Europe’s economic convergence has raised living standards across the continent, narrowing the gap between north and south, east and west. But inside many states the divide between the top and everyone else has widened.
This raises a larger question about what kind of future Europeans want. A continent that aims to act as a single economic and political force will need to reckon with how uneven prosperity feels on the ground. Because for all the talk of unity, a „rich“ European is still not the same everywhere — and these differences shape how people experience fairness, opportunity, and belonging.
Ultimately, the numbers can tell us who is rich, but not who feels that way. They also remind us that Europe’s prosperity — like its identity — depends on how evenly it is shared.
Sources and Methodology
All underlying data for this study come from Eurostat, the statistical office of the European Union. Figures are from 2024, the most recent year available. All averages are based on 27 EU countries, though country-level analyses include non-EU members Norway, Turkey, and Serbia.
The researchers used Eurostat income data along with an OECD scaling factor to estimate how much a household of two adults and one child (under age 14) would need to be at the 50th percentile and 90th percentile in their country. The process was as follows:
The researchers first collected „net equivalized income“ figures for people at the 50th percentile and 90th percentile. This metric is available through Eurostat’s EU-SILC (European Union Statistics on Income and Living Conditions) dataset. It represents income after taxes and social transfers, adjusted for household size to make living standards comparable. Each value, in euros, is effectively an income figure that reflects net earnings on a per-person basis.
The researchers also collected the purchasing power standard (PPS) values for people at the 90th percentile. This indicates how a „rich“ person’s net equivalized income compares across countries after adjusting for national-level price differences.
To make both the euro incomes and the PPS numbers easier to interpret, the researchers scaled up the equivalized values to estimate those values for a household of three. Each country’s equivalized income was multiplied by 1.8 in accordance with OECD’s modified scale that assigns a value of 1.0 to the first adult, 0.5 to each additional adult, and 0.3 to each child under 14.
This adjustment illustrates what „middle income“ and „high income“ might look like for a typical small household. These figures are not the exact percentiles for a three-person household, but an estimated benchmark.
The top 10% is a widely used benchmark in inequality research because it captures a meaningful share of high earners without being distorted by the extreme outliers in the top 1%. It offers a consistent way to compare how prosperity is distributed across and within countries.
Income gaps between the rich and the middle class were calculated by finding the percent difference in earnings (in Euros) between the 50th percentile and the 90th percentile.
Maria Fernandez
As a data journalist, Maria Fernandez transforms complex data into clear, compelling stories that resonate in the media. Her focus lies in uncovering critical social and economic trends through data analysis and visualization.