

How much it costs to collect €100 of tax in every EU country
Zusammenfassen mit


Beitrag teilen auf




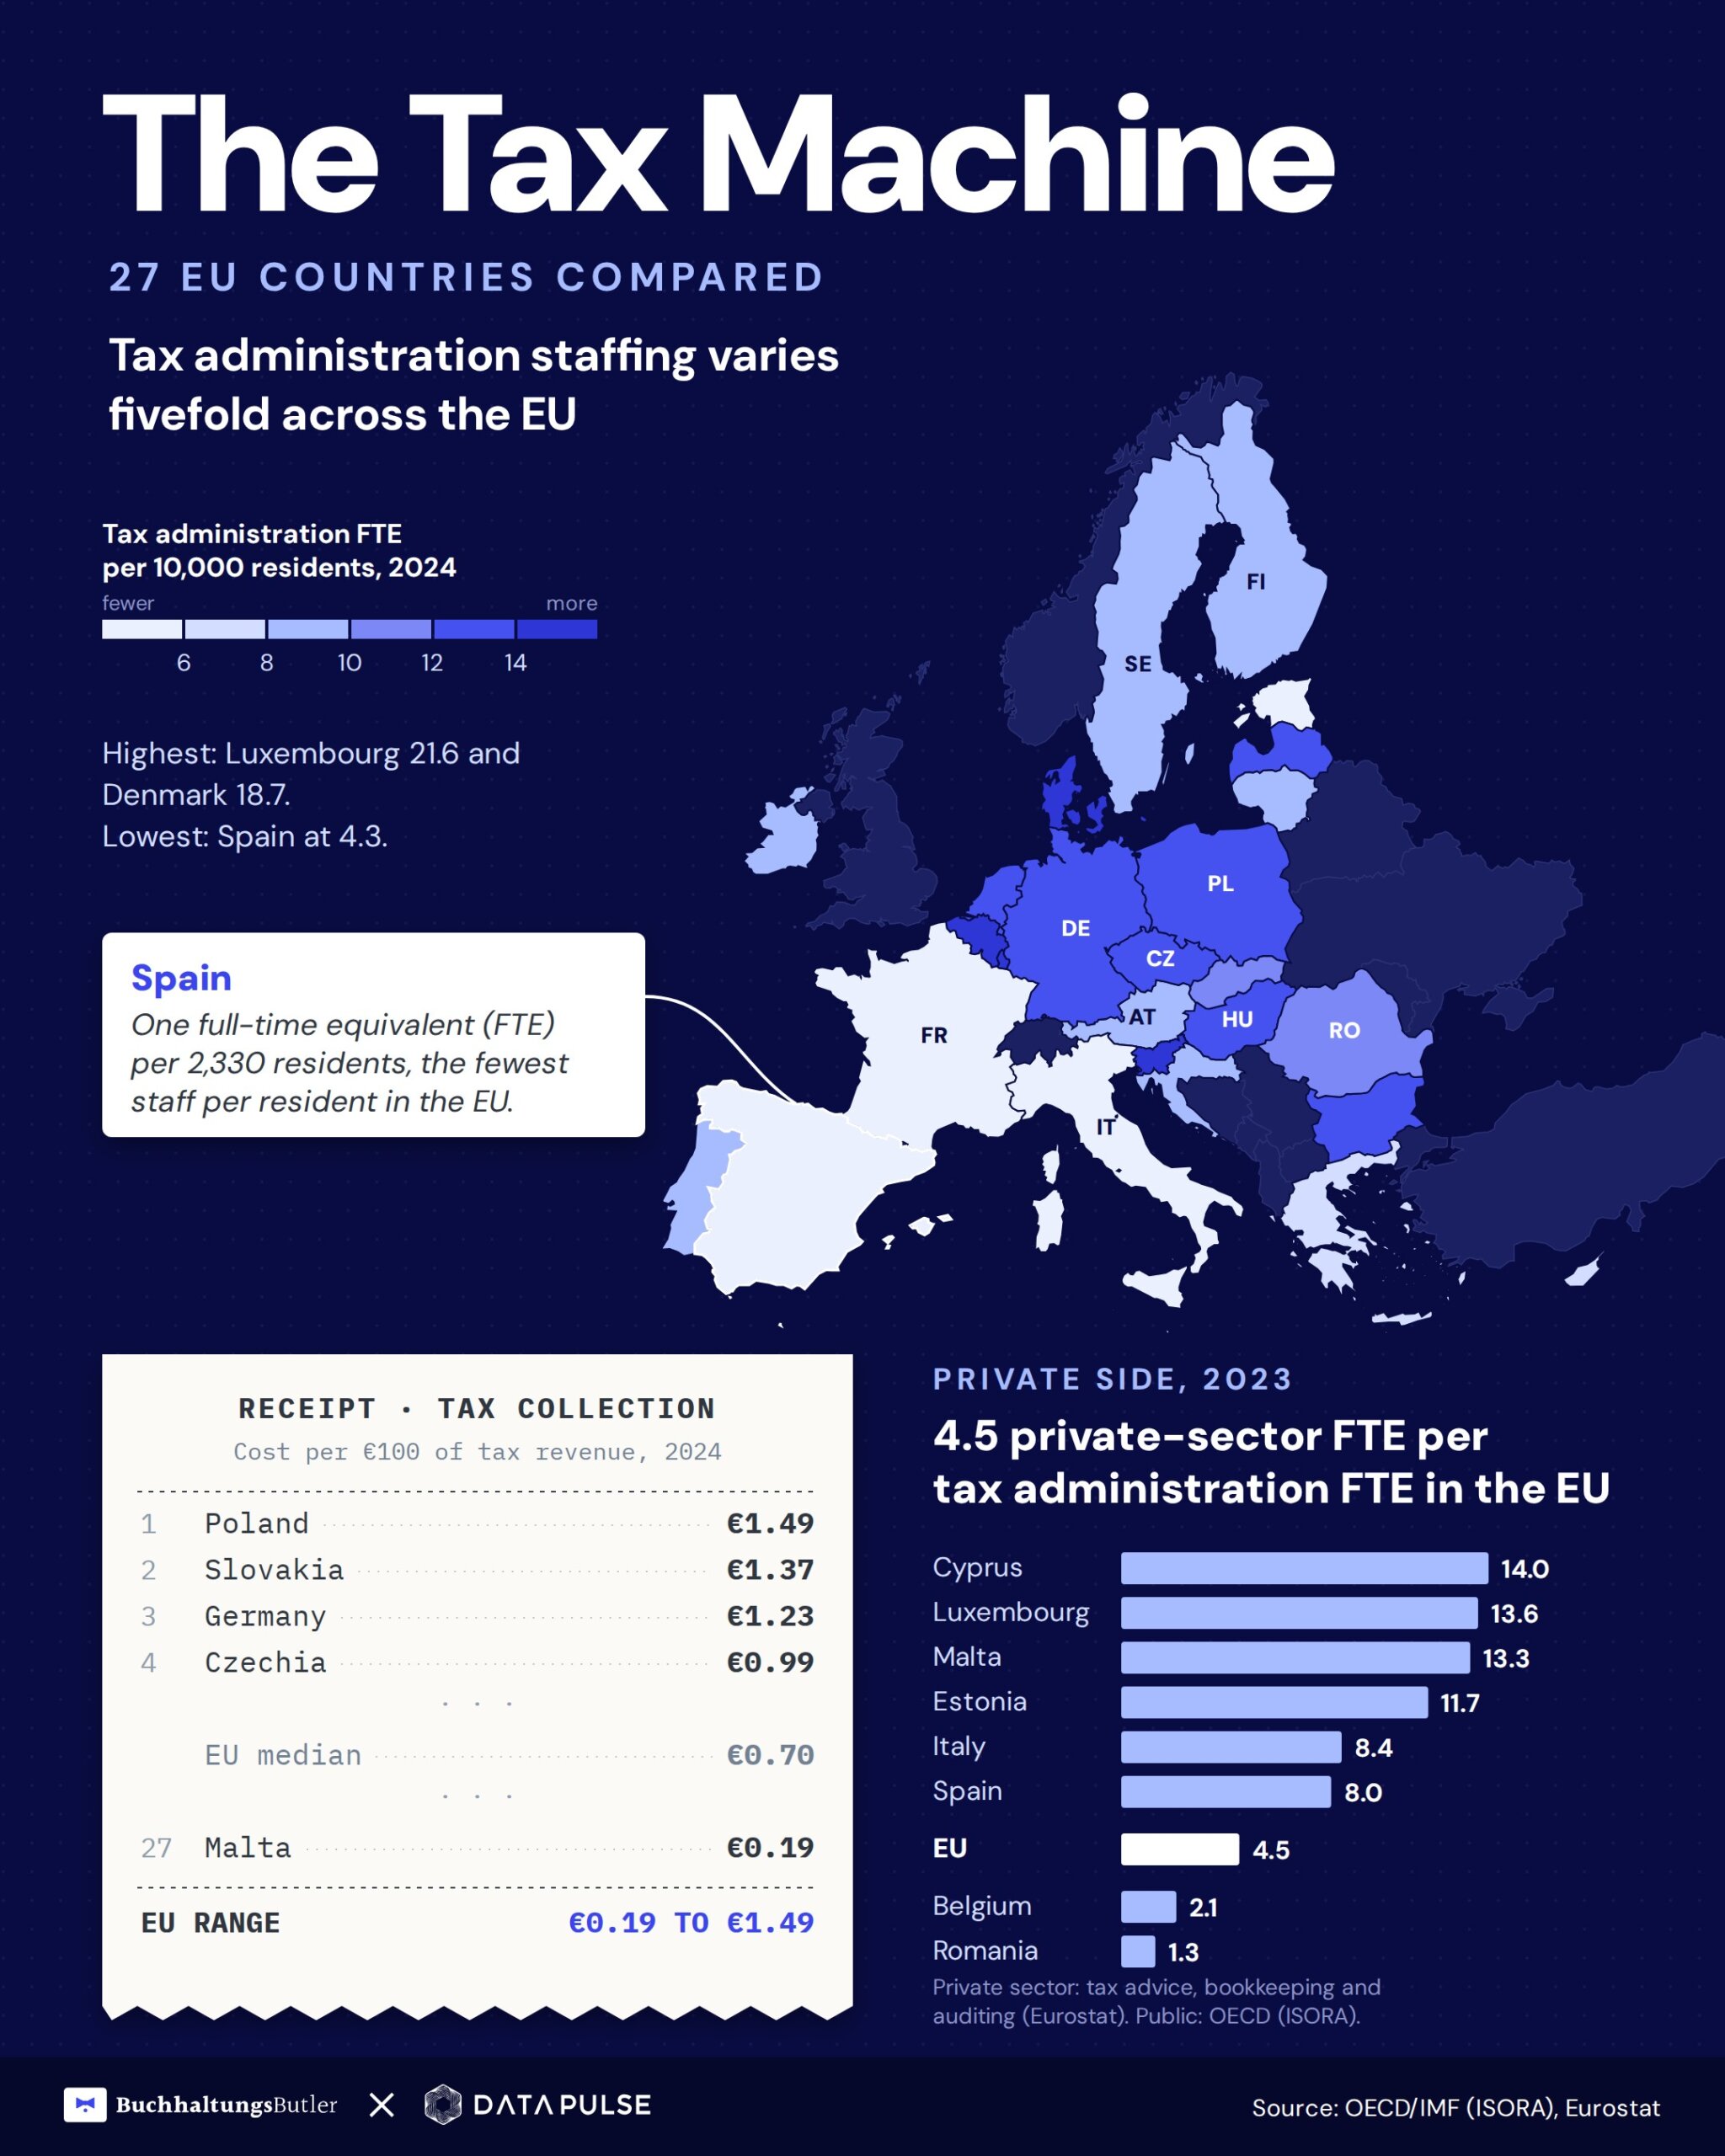
How large are Europe’s tax administrations, and what do they cost to run? Relative to population, the 27 EU countries vary widely: Luxembourg’s tax administration has 21.6 full-time equivalents (FTE) per 10,000 residents, and Spain has 4.3. Put another way, Germany has one FTE for roughly every 760 residents, Italy one for every 1,850 and Spain one for every 2,330. Germany’s tax administration is among the largest relative to population and has a high cost ratio, and its local tax offices are short-staffed.
Collecting taxes takes both people and money, in the tax administration as well as in tax advice, bookkeeping and auditing. This study compares all 27 EU countries and shows where each one stands.
Per €100 of tax revenue, running costs range from €0.19 in Malta to €1.49 in Poland. Germany spends €1.23 and ranks 3rd of 27 EU countries, behind Poland and Slovakia. The EU median is €0.70.
BuchhaltungsButler and DataPulse Research analysed the staffing levels and costs of the tax administrations in each EU country, along with the corresponding size of the private sector for tax advice, bookkeeping and auditing. The analysis draws on the OECD survey of tax administrations for 2024 and Eurostat’s business statistics for 2023. The figures show how large the administrations are and what they cost to run, but not how efficiently they work.
Luxembourg has the most tax administration staff per resident, while Spain has the fewest
In 2024, the EU’s tax administrations had 416,274 FTE in total, with 110,024 in Germany; across the EU, that’s 9.3 FTE per 10,000 residents. The range runs from 4.3 in Spain to 21.6 in Luxembourg. These figures are the full-time equivalents reported to the OECD and exclude customs-only staff.
With 13.2 tax administration FTE per 10,000 residents, Germany ranks 7th of the 27 EU countries. That is about three times as many as Spain, which has 4.3. Only Luxembourg, Denmark, Slovenia, Belgium, the Netherlands and Hungary have larger administrations than Germany relative to population size. The dashed rows show the United Kingdom and Norway on the same OECD count.
Four of the six countries with more staff per resident than Germany also collect social security contributions through their tax administration. In Germany, the statutory health insurance funds are responsible for that task. Counting only the 14 tax administrations that do not collect social security contributions, Germany ranks 3rd, behind Luxembourg and Belgium. Belgium overtook Germany in 2024 after its reported staff rose by 9.5%.
In all, 13 of the 27 EU tax administrations also collect social security contributions. This extra task affects both staff numbers and reported revenue, and it limits direct comparisons between countries. The two reference countries outside the EU, the United Kingdom and Norway, also have this task.
Poland and Slovakia have the highest collection costs, followed by Germany
To collect €100 of tax, Germany’s tax administration spends €1.23. Only Poland and Slovakia spend more, at €1.49 and €1.37 respectively. France, Italy and Spain spend €0.65, €0.55 and €0.46. Like Germany, these administrations do not collect social security contributions. Among the 14 administrations without this task, the median cost is €0.71.
Poland, Slovakia, Germany and Czechia have the four highest collection costs in the EU, and they form a contiguous group in Central Europe. Clicking a country shows the figures for its tax administration and private sector. The interactive receipt further down compares all countries.
Poland has the highest cost ratio in the EU. Staff costs rose by 31% in 2024, while staff numbers grew only 2.7%.
Germany’s ratio has been between €1.2 and €1.4 per €100 of tax revenue collected every year since 2018 (OECD figures, rounded to one decimal).
In 2024, Germany’s tax administration spent €10.7 billion on running costs. That is €128 per resident, placing it 4th in spending per resident among the 27 EU countries compared. France spent €64 per resident, Italy €52 and Spain €28.
The ranking also depends on which revenue sources and tasks each country includes in its figures. The OECD names several limits to the comparison:
- Collecting social security contributions adds them to an administration’s revenue, which can lower its cost ratio. Among the 14 administrations without this task, Germany also ranks 3rd, behind Poland and Slovakia.
- Germany’s reported revenue excludes excise duties, because customs collects them. In Poland, they make up 14% of reported revenue; in Spain, 8%. Including them would lower Germany’s ratio. If anything, the different definitions push Germany’s cost ratio up in the comparison.
- A higher share of VAT, or of taxes withheld at source, can lower collection costs relative to revenue. Accounting differences also affect the ratio.

Germany’s local tax offices are short of staff, with almost 6,900 posts empty
A closer look at Germany shows what lies behind such figures. It has the EU’s largest tax administration in absolute terms, and its government reports budgeted, filled and empty posts for the local tax offices. The 110,024 FTE in the OECD comparison covers the Federal Central Tax Office, the tax staff of the Federal Ministry of Finance and the 16 state tax administrations, including their local tax offices (Finanzämter).
The wider finance administration also includes customs, the finance ministries, the state treasuries and the payroll offices. In June 2024, it employed 197,800 people in total.
The figures below on budgeted, filled and empty posts, by contrast, refer only to the local tax offices.
- From 2009 to 2025, staff available for work in the local tax offices fell by 5.7%, from 102,580 to 96,736 FTE (Bundestag document 19/13748; 2025: Federal Ministry of Finance). Budgeted posts rose from 109,060 in 2017 to 110,752 in 2023.
- In 2023, the local tax offices had 110,752 budgeted full-time posts. According to the government, 103,923 posts were filled, and 6,828 were empty. The staff available to work came to 97,350 FTE (Bundestag documents 20/13523 and 21/2452).
- In 2024, 6,869 posts were empty (Bundestag document 21/2452).
The German tax officials’ union DSTG estimates the finance administration’s shortfall will be around 45,000 staff by 2030. The DSTG extrapolated that figure from a public-sector study.

Financial centres have the largest private sectors per resident; Germany’s is large but mid-table
In 2023, 464,000 people worked in tax advice, bookkeeping and auditing in Germany. Because many of them work part time, that equals 397,000 full-time equivalents. By headcount, Germany’s private tax sector is the largest of its kind in the EU. Relative to population, however, it is mid-table, ranking 11th of the 27 EU countries.
Luxembourg, Cyprus, Malta and Ireland lead the ranking of private-sector FTE per 10,000 residents. In these financial centres, firms also serve investment funds and foreign companies.
Measured against the national tax administration rather than population, Germany ranks lower. In Germany, there are 3.6 FTE in tax advice, bookkeeping and auditing for every one FTE in the national tax administration. This ratio puts Germany 21st of the 27 EU countries. For the EU as a whole, the ratio is 4.5.
Between 2014 and 2025, employment in tax advice, bookkeeping and auditing in Germany rose by 28%, counting employees subject to social security contributions. The sector grew faster than total employment, which rose by 16%. Staff at the local tax offices, by contrast, fell by 3.5%, measured in full-time equivalents.
View the time series data
| Year | Private sector | All employees | Local tax offices |
|---|---|---|---|
| 2014 | 275,866 | 30,174,505 | 100,276 |
| 2015 | 283,222 | 30,771,297 | 99,605 |
| 2016 | 289,150 | 31,443,318 | 99,100 |
| 2017 | 298,133 | 32,164,973 | 98,667 |
| 2018 | 306,089 | 32,870,228 | 97,636 |
| 2019 | 313,018 | 33,407,262 | 96,898 |
| 2020 | 317,094 | 33,322,952 | 96,602 |
| 2021 | 321,500 | 33,802,173 | 97,189 |
| 2022 | 332,847 | 34,445,087 | 97,603 |
| 2023 | 344,357 | 34,709,056 | 97,350 |
| 2024 | 347,467 | 34,837,102 | 96,901 |
| 2025 | 354,102 | 34,885,488 | 96,736 |
Sources: Federal Employment Agency; German government answers to parliamentary questions in the Bundestag; Federal Ministry of Finance
What this means for the self-employed and small businesses in Germany
In Germany, the local tax offices have lost around 3.5% of their staff since 2014, if measured in full-time equivalents. Over the same period, tax advisers, bookkeeping firms and auditors have increased their workforce by 28%. For the self-employed and small businesses, day-to-day bookkeeping remains a task shared between the business and its tax adviser. Receipts have to be collected, transactions recorded and tax returns prepared.
Digital tools can make this shared work easier. E-invoicing is one place to start: structured invoice data can be read and recorded automatically. Together with digital receipts and an agreed way of passing data to the tax adviser, e-invoicing can simplify a business’s bookkeeping.
What the figures do not show
The study covers the staff and running costs of the tax administrations and the size of the private tax advice, bookkeeping and auditing sector. It cannot show how efficiently an administration works or how many staff it needs. Nor does it capture the total effort businesses and households put into managing their taxes.
Every country as a receipt
The key figures for each country’s tax administration and its tax advice, bookkeeping and auditing sector, set out as a receipt.
All 27 EU countries as a table
The table shows each tax administration’s staff per 10,000 residents and its running costs per €100 of tax revenue. It also shows the full-time equivalents (FTE) in tax advice, bookkeeping and auditing per 10,000 residents, and the ratio between private-sector FTE and tax administration FTE.
Each value has its EU rank below it. ° also collects social security contributions · * financial centre · ** France: narrow definition · † Romania: self-employed accountants probably undercounted. Explanations below the table.
| Country | Tax administration FTE per 10,000 residents (2024) | Running costs per €100 of tax (2024) | Private-sector FTE per 10,000 residents (2023) | Private FTE per tax administration FTE (2023) |
|---|---|---|---|---|
| Luxembourg | 21.6 Rank 1 | 0.89 Rank 5 | 282.8* Rank 1 | 13.6* Rank 2 |
| Denmark | 18.7° Rank 2 | 0.82 Rank 8 | 38.1 Rank 21 | 2.2 Rank 25 |
| Slovenia | 14.1° Rank 3 | 0.64 Rank 17 | 35.5 Rank 22 | 2.5 Rank 24 |
| Belgium | 14.0 Rank 4 | 0.72 Rank 13 | 26.5 Rank 26 | 2.1 Rank 26 |
| Netherlands | 13.7° Rank 5 | 0.79 Rank 9 | 52.9 Rank 9 | 4.1 Rank 17 |
| Hungary | 13.3° Rank 6 | 0.78 Rank 10 | 68.7 Rank 5 | 5.0 Rank 12 |
| Germany | 13.2 Rank 7 | 1.23 Rank 3 | 47.8 Rank 11 | 3.6 Rank 21 |
| Poland | 12.8 Rank 8 | 1.49 Rank 1 | 42.4 Rank 17 | 3.4 Rank 22 |
| Latvia | 12.5° Rank 9 | 0.73 Rank 11 | 38.1 Rank 20 | 2.9 Rank 23 |
| Czechia | 12.4 Rank 10 | 0.99 Rank 4 | 52.6 Rank 10 | 4.1 Rank 17 |
| Bulgaria | 12.3° Rank 11 | 0.88 Rank 6 | 45.9 Rank 13 | 3.7 Rank 20 |
| Slovakia | 10.3 Rank 12 | 1.37 Rank 2 | 59.7 Rank 7 | 5.7 Rank 10 |
| Romania | 10.2° Rank 13 | 0.73 Rank 11 | 13.7† Rank 27 | 1.3† Rank 27 |
| Ireland | 9.5° Rank 14 | 0.33 Rank 25 | 76.1* Rank 4 | 7.8* Rank 7 |
| Croatia | 9.3° Rank 15 | 0.58 Rank 18 | 39.5 Rank 19 | 4.3 Rank 16 |
| Austria | 9.0 Rank 16 | 0.70 Rank 14 | 42.9 Rank 15 | 4.9 Rank 14 |
| Finland | 8.9° Rank 17 | 0.57 Rank 19 | 35.2 Rank 24 | 3.8 Rank 19 |
| Sweden | 8.6° Rank 18 | 0.36 Rank 24 | 42.7 Rank 16 | 4.8 Rank 15 |
| Portugal | 8.3 Rank 19 | 0.86 Rank 7 | 53.3 Rank 8 | 6.4 Rank 9 |
| Lithuania | 8.3 Rank 20 | 0.42 Rank 23 | 43.3 Rank 14 | 5.0 Rank 12 |
| Cyprus | 7.3 Rank 21 | 0.69 Rank 15 | 107.7* Rank 2 | 14.0* Rank 1 |
| Malta | 6.7° Rank 22 | 0.19 Rank 27 | 88.4* Rank 3 | 13.3* Rank 3 |
| Greece | 6.6 Rank 23 | 0.56 Rank 20 | 47.7 Rank 12 | 6.9 Rank 8 |
| France | 5.4** Rank 24 | 0.65 Rank 16 | 29.9 Rank 25 | 5.3 Rank 11 |
| Italy | 5.4 Rank 25 | 0.55 Rank 21 | 41.7 Rank 18 | 8.4 Rank 5 |
| Estonia | 4.8° Rank 26 | 0.23 Rank 26 | 63.8 Rank 6 | 11.7 Rank 4 |
| Spain | 4.3 Rank 27 | 0.46 Rank 22 | 35.4 Rank 23 | 8.0 Rank 6 |
| Outside the EU, same OECD count (not ranked) | ||||
| United Kingdom | 8.3° | 0.62 | – | – |
| Norway | 12.5° | 0.42 | – | – |
° also collects social security contributions. * Financial centre: accounting and audit firms work for many foreign clients and funds. ** France: narrow definition, tax work only; the DGFiP has 2.4 times as many full-time equivalents. † Romania: self-employed accountants probably undercounted. The ratio of private-sector to tax administration full-time equivalents uses 2023 on both sides (tax administration 2023: Italy 5.0, Germany 13.3 per 10,000 residents). Ranks per resident use unrounded values (Portugal before Lithuania at 8.3; France before Italy at 5.4); for the ratio, countries with the same rounded value share a rank; costs are ranked on two decimals. Switzerland and the United States are not shown: their OECD figures cover only the federal administration. Sources: OECD (ISORA) via the IMF, fiscal year 2024; Eurostat sbs_ovw_act (2023) and demo_pjan; World Bank population for the reference rows.
Methodology in brief
- Tax administrations: the OECD’s ISORA survey, fiscal year 2024, from the IMF database; full-time equivalents excluding customs, per 10,000 residents; costs as running costs per €100 of net revenue. “Typical” means the median of the EU countries.
- Private sector: Eurostat business statistics, tax advice, bookkeeping and auditing, 2023, with each owner counted as one full-time equivalent.
- Germany: German government answers to parliamentary questions in the Bundestag, Federal Ministry of Finance, Federal Employment Agency, Destatis.
Sources and methodology in detail
Tax administrations: International Survey on Revenue Administration (ISORA, run by the OECD, IMF, IOTA, CIAT and ADB), fiscal year 2024, from the IMF’s ISORA database (2025 survey round). The OECD report Tax Administration 2025 publishes fiscal year 2023 from the same survey. In fiscal year 2023, Germany ranked 6th of 27 per resident (13.3), with costs of €1.3 per €100 of net revenue (rounded to one decimal, as the OECD publishes it). Following table A.18, the count is the tax administration’s total full-time equivalents (FTE). For joint tax and customs administrations, the count is the OECD’s estimate for the tax function only, excluding customs-only staff. For Germany the count is 110,024 in 2024 (110,592 in 2023) in the Federal Ministry of Finance, the Federal Central Tax Office and the 16 state tax administrations. Customs and municipal tax offices are not part of the reporting body. Denmark’s figure covers more than the core tax agency, because the same ministry group also runs debt collection, property valuation and motor vehicle taxes. Belgium reported 9.5% more staff in 2024, after the number had fallen by 4% from 2018 to 2023. France’s figure is the tax share of the DGFiP, which also runs public accounting, local authority treasury and the land registry. The DGFiP’s own full-time count is 2.4 times the OECD figure. Population figures come from Eurostat demo_pjan, at 1 January 2024 for the administrations and 1 January 2023 for the private sector; the per-resident rank uses unrounded values. Collection costs are ISORA’s running costs of collection (OECD table D.6): total running costs divided by total net revenue, times 100. They are shown to two decimal places, and the ranks use these values; the OECD report rounds them to one decimal place. The OECD points out that differences in tasks, in responsibility for social security contributions and in accounting limit direct comparisons. Responsibility for social security contributions comes from table A.3. The euro amounts per resident use the running costs each administration reports (ISORA table A.16). For countries outside the euro area, these running costs are converted at the European Central Bank’s average rates for 2024. The reference countries use the same tables: the United Kingdom (HMRC, a joint administration; OECD estimate for the tax function only) and Norway, whose agency also runs the population register and state debt collection. Population figures for the two reference countries come from the World Bank, 2024. Switzerland is left out because its OECD row covers only the Federal Tax Administration (998 FTE), while the cantons collect most taxes. The United States is left out for the same reason (the federal IRS with 90,516 FTE, without the state tax agencies).
Private sector: Eurostat business statistics (sbs_ovw_act), NACE 69.2 (tax advice, bookkeeping and auditing), persons employed including owners, 2023, the latest year in which all 27 countries count the same way. Full-time equivalents are the employees’ full-time equivalents plus one for each owner. Shares relate to total employment in the national accounts (nama_10_a10_e). The financial centres (Luxembourg, Cyprus, Malta, Ireland) are marked because their accounting and audit firms serve investment funds and foreign-owned companies. Romania’s self-employed accountants are probably undercounted. Half of the people working in Italy’s sector are self-employed.
Germany: Full-time equivalents of the local tax offices at year-end, from the German government’s answers to parliamentary questions in the Bundestag (documents 19/13748, 19/28322, 20/7292, 21/2452, 20/13523 for budgeted posts, filled posts and staff available in 2023; 21/2452 for empty posts in 2023 and 2024), and for 2025 from the Federal Ministry of Finance (“Die Steuerverwaltung in Deutschland”, 2026). Private-sector employees are counted by the Federal Employment Agency as employees subject to social security contributions, WZ 69.2 (NACE 69.2), at 30 June each year from 2014 to 2025, compared with all such employees. The figure for the whole finance administration comes from the Destatis public-sector personnel statistics, category Finanzverwaltung (including customs, finance ministries, state treasuries and payroll offices), at 30 June 2024: 197,800 employees. This figure only puts Germany in context and is not used in any country comparison. The union figure comes from the DSTG campaign page (“rund 45.000 fehlende Beschäftigte”, around 45,000 missing staff), extrapolated from a study of the whole public sector. The local tax office series counts staff available for work, in full-time equivalents; it does not include budgeted posts. The map uses country boundaries from GISCO, © EuroGeographics.
Robustness: Per resident, Germany ranks 7th of the 27 EU countries in 2024 (6th in 2023), 3rd of 14 among the tax-only administrations and 3rd of 27 on costs; its cost ratio has been between €1.2 and €1.4 per €100 every year since 2018 (OECD figures, one decimal). Per resident, Germany ranked 8th from 2018 to 2021, 7th of 26 in 2022 (no data for Romania), 6th in 2023 and 7th in 2024, so the result is not a one-year effect. For the private sector, Germany stays in the lower half on the ratio under every definition (headcount, employees only, without France or without the financial centres). The full calculation with all formulas is available on request from BuchhaltungsButler’s press office.